You may have noticed a new buzzword emerging in the technology sector in 2012-13: “big data.” This has come about with the emergence of a new sector in the technology and business world called big data analytics. But what exactly is big data, and how does one analyze it? Here’s a quick one-page introduction to the core concepts surrounding big data.
What’s So Big About Big Data?
The name “big data” refers to data that is just that: big. However, the use of the word “big” can be misleading. Not all big data is classified as such simply due to the actual size of the data; there are also other properties of data that can cause it to be classified as “big,” such as high speed of transmission and a large variety of sources. What sets big data apart from other types of data, then, is not necessarily just size, but also the fact that big data can not be processed by traditional database systems. Even the most advanced Excel spreadsheet could not even come close to providing the right type of processing needed to analyze big data.
Where Did Big Data Come From?
Big data is a recent phenomenon. The concept has arisen in recent years due to new innovations in science and technology that have allowed huge amounts of data to be created at unprecedented speeds from an unprecedented variety of sources. The necessity of processing big data has arisen both in the scientific community and the business world. A huge factor in the rise of big data has been the emergence of cloud-based technology and GPS-enabled mobile devices. Thanks to the constant transmission of information between mobile devices through the cloud, there is now so much data available that traditional data processing systems are no longer able to analyze the information contained within this data.
What Does Big Data Analytics Do?
Big data analytics is the process of using new and advanced analytics techniques such as machine learning, data mining, predictive analytics, and so on in order to extract important information from big data sources. This is useful both for researchers hoping to make new discoveries, and for businesses looking to make better-informed decisions, which will in turn lead to increased profits and savings.
Is Big Data Expensive?
Yes. Access to the most sophisticated big data analytics is costly due to the resources needed to produce something so powerful, but also because of the companies who make use of the technology. Mostly, you will find major companies like airlines and hotel chains using big data analytics, so most solutions cost in the tens of thousands of dollars per month. The above should give you a good basic idea of how big data analytics works. However, big data analytics is a complex and ever-changing field of study, which means that there’s always a lot to learn. Keeping up with the latest on big data could mean big advantages for businesses, researchers, and individuals alike, so be sure to keep up with the latest advancements in this fascinating new industry.
Ijento offers sophisticated big data analytics.
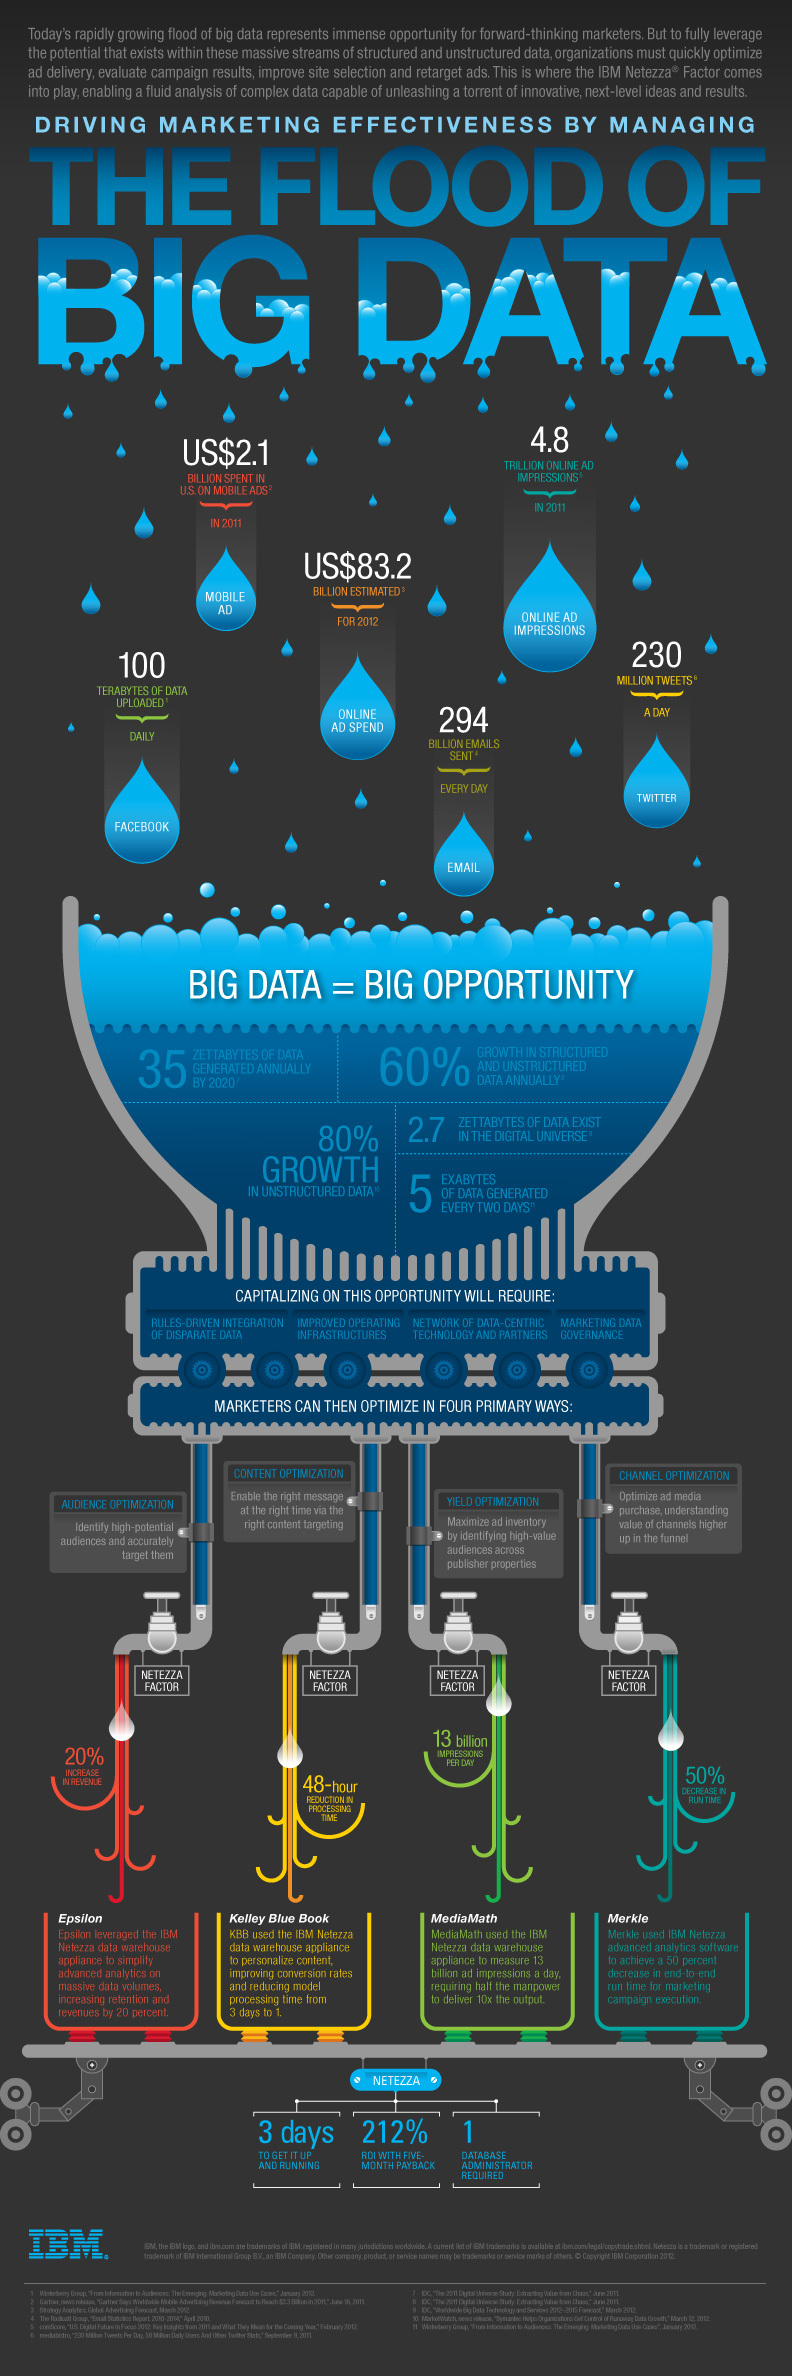
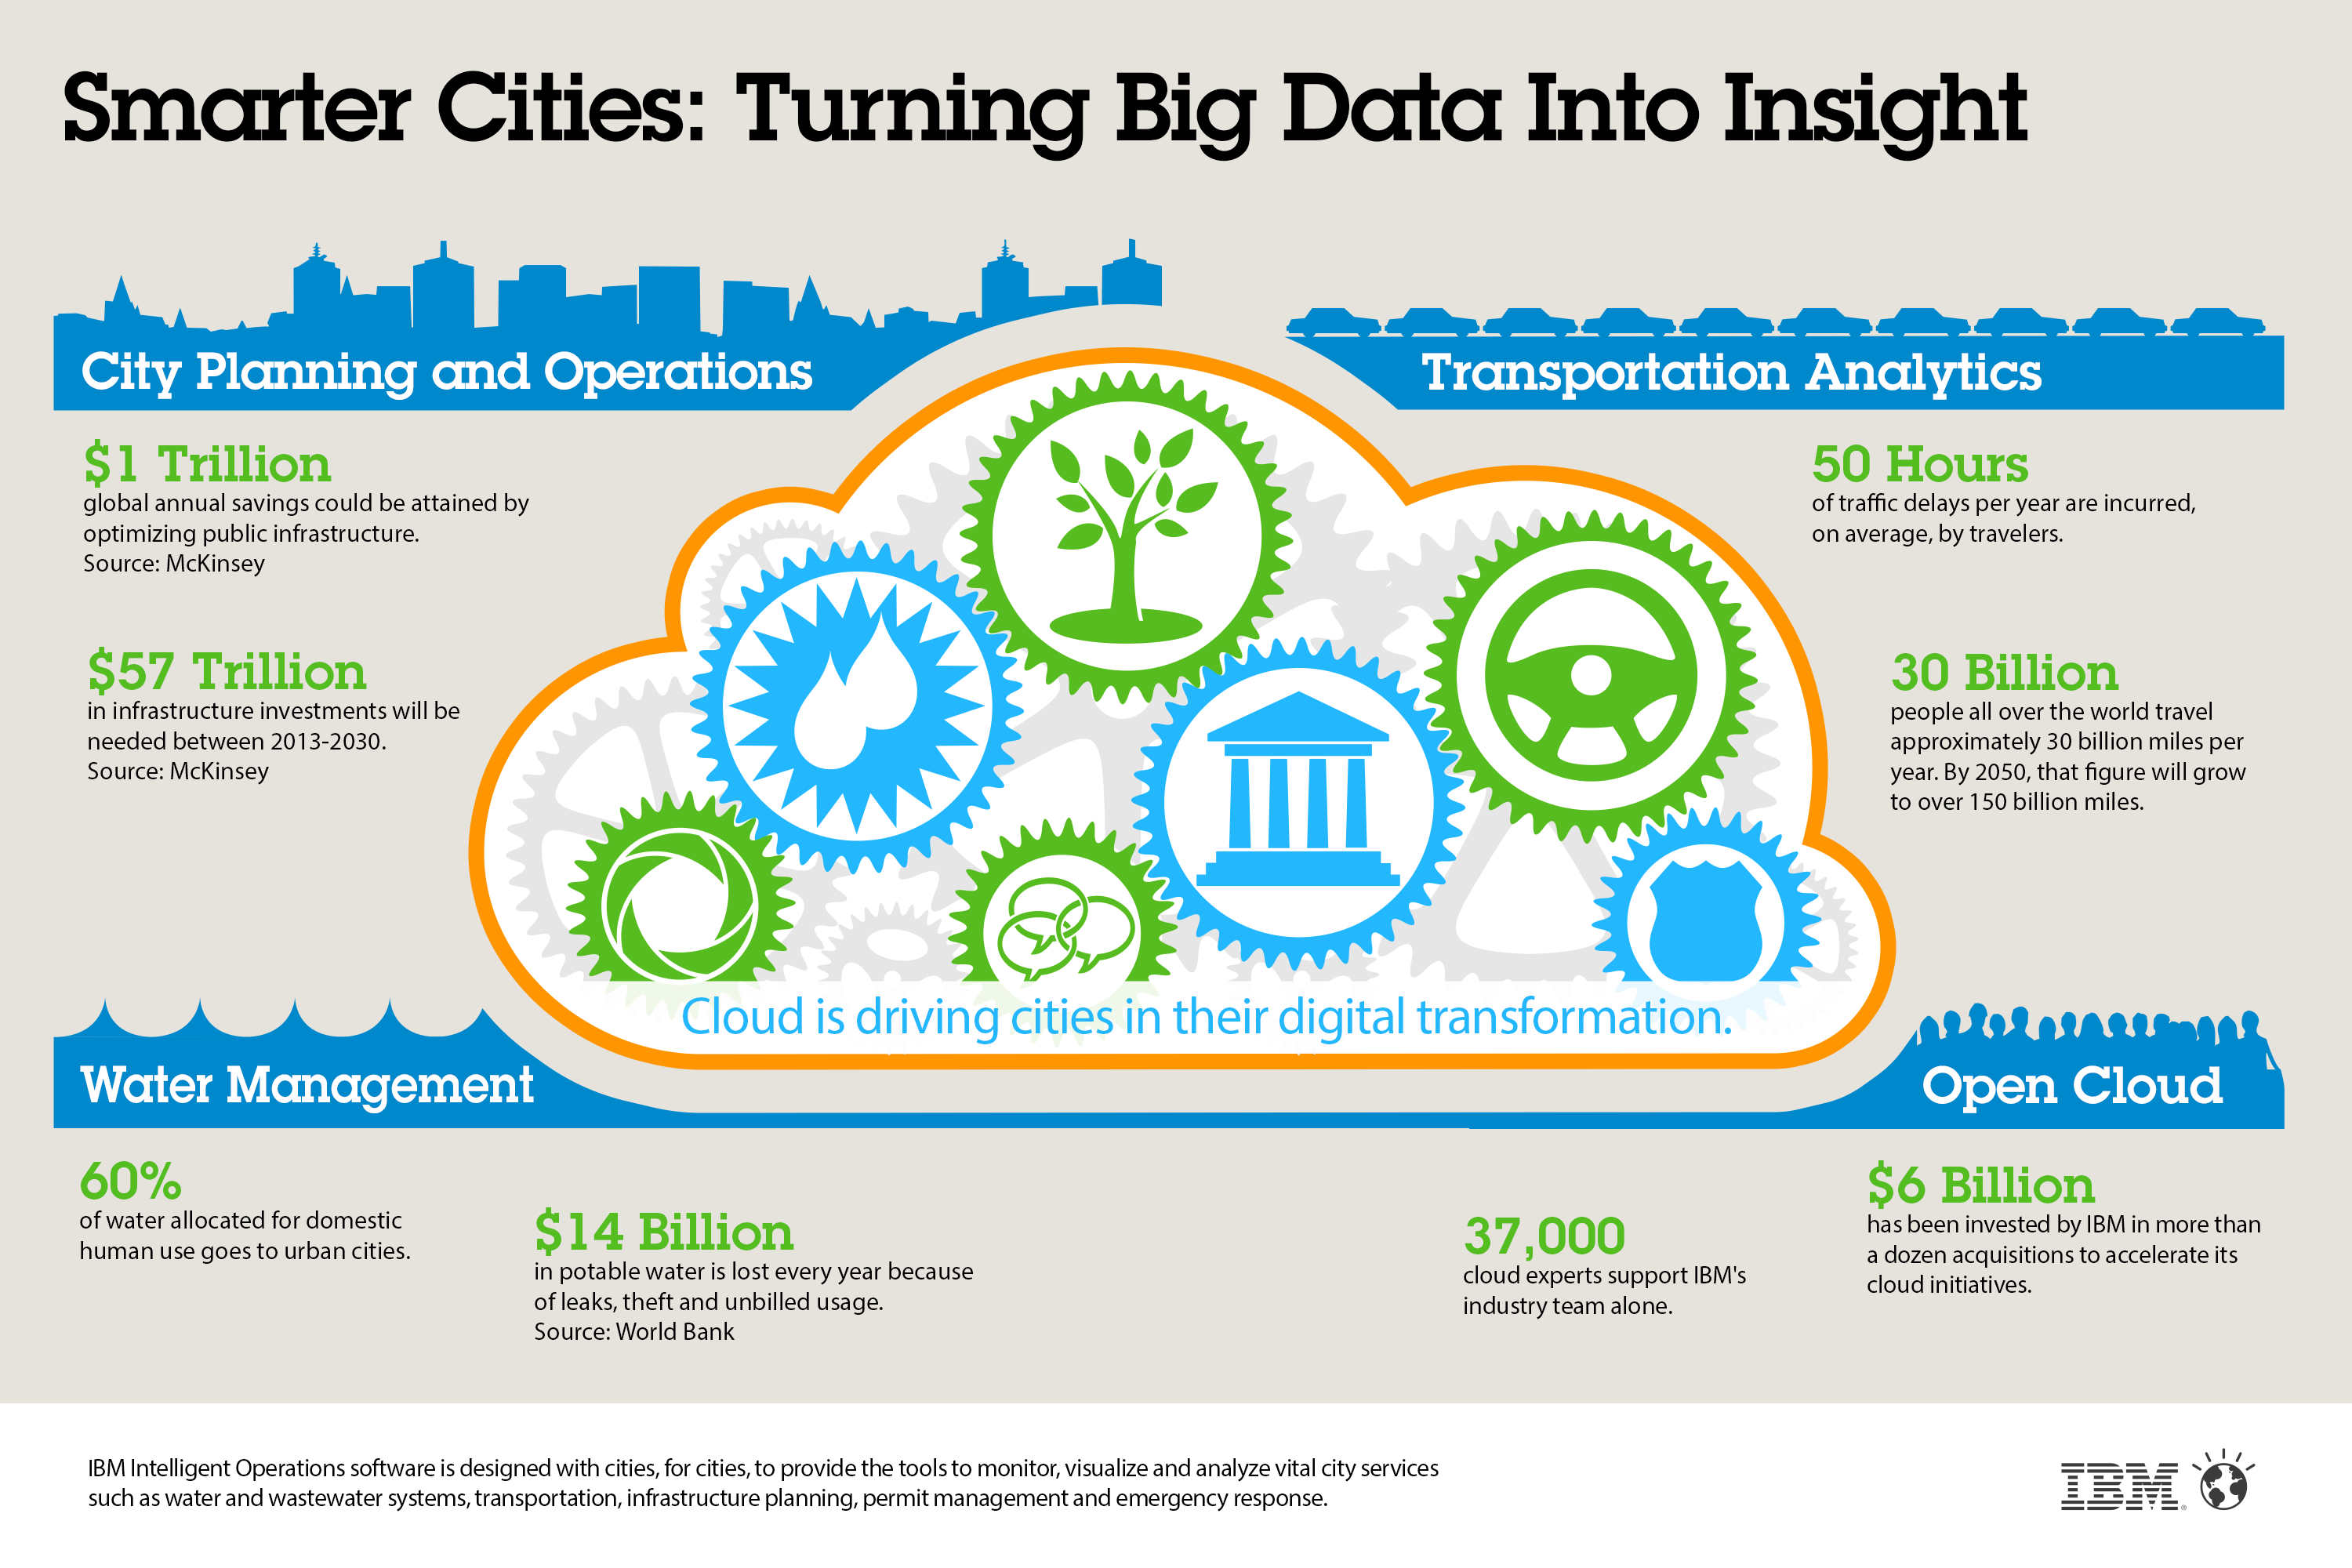
Here’s also an infographic from IBM: