Email marketing company Reachmail has put together a really cool infograhpic that shows why it…
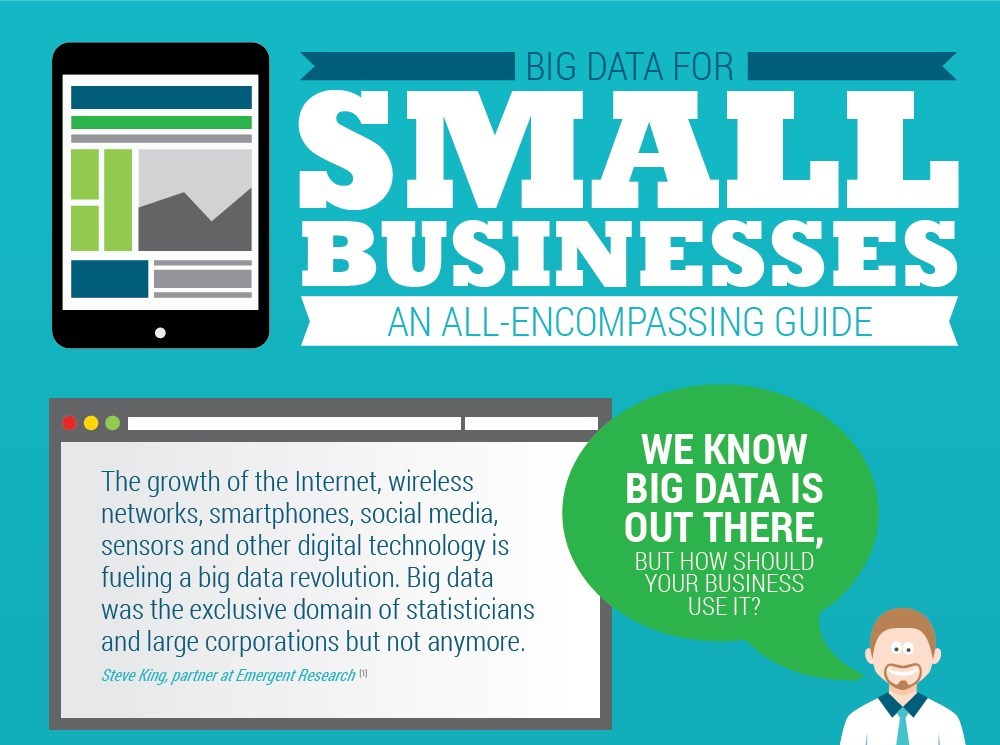
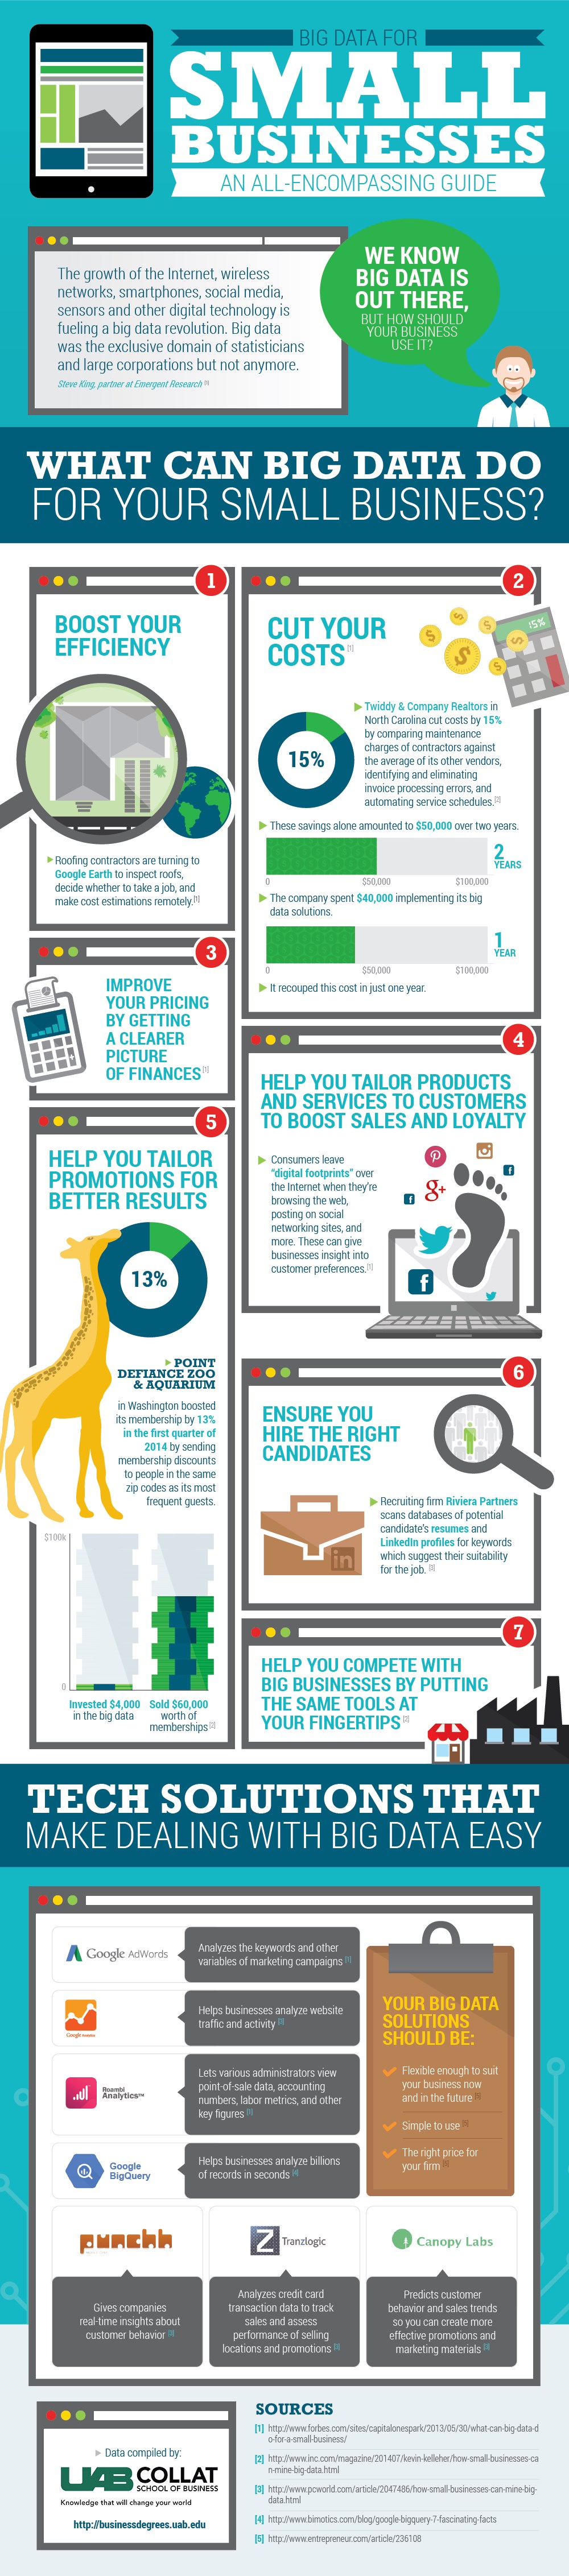
Over the last few years, social media platforms and online interactions have increased many fold. Businesses are using more digital technologies than before. Ecommerce, online ads, polls and surveys have become standard for marketing operations. These technologies are all data driven. Even small and medium businesses today need data analytics at an unprecedented scale. To keep track of all the organizational data flow, modern CRMs and ERPs too have to be able to integrate with online data sources. The landscape of marketing has changes so much that now all the sales data, customer reviews, social media chatter goes hand in hand with company’s search data, content generation and employee satisfaction. How can your organization navigate such a complex plane of modern business reality? Well, a collective method to handle this “Big Data” is to go with the available solutions. A data scientist can help you combine features of generic web tools like Google Analytics with outputs of specialized big data solutions like Tranzlogic to develop an efficient system to track down customer behavior. This infographic from UAB Collat School of Business covers the benefits to your small business using Big Data, from boosting efficiency, to helping you compete with big businesses:
Is your business utilizing big data? What’s most effective marketing strategy for your data driven business? Leave your comments below. If you have an interesting infographic to share with us, just submit here.
Embed This Image On Your Site (copy code below):
- Editor Rating
-
Technology
-
Marketing
-
Infographic
-
Total score
- User Rating
-
Technology
-
Marketing
-
Infographic
-
Total score
Are you a business owner? Are you looking for more small business tips and branding knowledge? If yes then you should probably subscribe to TLB right away. We promise we won't spam your inbox.
Zac Jackson
Latest posts by Zac Jackson (see all)
- Don’t Just Think Big – Think “Moon-Shot”, Inspiring Modern-Day Entrepreneurs [Infographic] - February 22, 2016
- The Most Damaging Data Breaches in History [Infographic] - January 21, 2016
- Why Business Intelligence Is Key For Competitive Advantage [Infographic] - January 8, 2016
You may also find these articles useful
-
Integrating Social Media Marketing with Email Marketing [Infographic]
-
[Infographic] How To Use Tumblr For SEO and Social Media Marketing
Tumblr is Social Media Plus SEO! Tumblr is one site that has been in the…
-
Different Techniques To Get Followers On Social Media [Infographic]
Small business depends on social media for promoting their product.The cheapest way of getting promoted…
-
Why Business Intelligence Is Key For Competitive Advantage [Infographic]
Business intelligence represents the systems and tools that are important in the strategic planning processes…
Other Posts by Zac Jackson
Posts about Brand Development
Posts about SME & Local Business
-
Build Your Own Fireplace Hearth In These 5 Steps
-
Meeting The New Demands Of Manufacturing
-
What Is Dangerous Goods Training And Why Is It Useful?
-
4 Franchising Mistakes Made By Business Owners
-
Your Packaging is the Brand Message!
-
Slow but Steady: Business in Arizona’s Post-Recession Economy, Part Three
Search Brand Directory
How Much People Work Around The World [Infographic]

Forty hours is often considered a typical work week, but how often is this actually the case? To find out, GetVoIP compiled data about average full-time work weeks around the world and created this infographic. Northern European countries like Denmark and the Netherlands had the shortest work weeks, 38.